5 Practical Dataview Plugin Snippets To Know In Obsidian
Overview
If, like me, you have hundreds if not thousands of notes building up in Obsidian, you may have started to find the search bar cumbersome. So, even though you might be capturing notes successfully, not finding them when needed loses the benefit of a note-taking system.
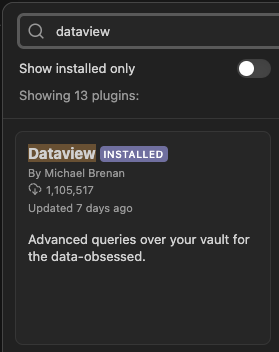
Fortunately, there is a plugin to help. It is called DataView, and it is one of the most popular community plugins on Obsidian.
Using DataView allows you to:
- Find your notes faster, mainly when you have built a lot of notes
- Automate your obsidian workflows; Dataview will update automatically as the user adds notes.
- It can also help you rediscover notes you might have forgotten about and generate ideas
I am sharing some snippets that I use in the hope you will use them to inspire your workflow.
They range from beginners to advanced users, particularly one that took me a few days to work out, so I hope there is something new for you to discover.
If you want more techniques, tools and hacks for your workflow, please subscribe to my blog.
1. Last modified files
The most common DataView I use lists the last notes I have changed.
This DataView sits on my main obsidian dashboard and allows me access to the last notes I was working on or new notes that have come into the vault.
Once you have installed DataView, type the following into a note.
```dataview
List
From ""
Sort file.mtime DESC
Limit 5

```
The first line tells Obsidian to use the DataView plugin
The second line - List - tells the plugin how to display the result
The third line - From - tells the plugin which folder to use. It will look at the whole vault if you leave it empty.
The fourth line - Sort- tells the plugin how to sort the plugin
The fifth line - Limit - tells the plugin how many rows to display
The final line tells the plugin there is no more code to process
LeLet's’ee it in action.
Switching between source mode and reading mode activates the results.
If you activate live preview, it will generate on the fly.
DataView has a range of parameters to try out to optimise your result.
But the best results I have found are when combined with other plugins.
Let’s see how I use them.
2. List all books and highlights
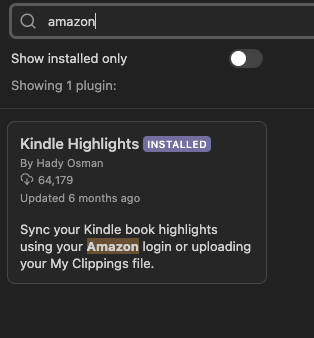
I use the Kindle Highlight plugin to list highlights I have made in Kindle books and track the books I have been reading.
Let’s look at the snippet.
```dataview
TABLE kindle-sync.title as "Full Title", kindle-sync.author as "Author", kindle-sync.lastAnnotatedDate as "Last Highlighted", kindle-sync.highlightsCount as "Number of Highlights"
FROM "Library"
SORT kindle-sync.lastAnnotatedDate desc
Limit 5
```
In this one, I am creating a table with different column names.
I am using the Kindle-Sync property as the column names I want and renaming them to what I want to display.
The From part tells the DataView to look in a specific folder.
I have sorted it by when I last added highlights and limited to 5 books.
Let’s see it in action.
Another feature of DataView is you can add images to it.
If I add another column called bookImageUrl, it contains an image link to retrieve the book cover.
```dataview
TABLE kindle-sync.title as "Full Title", kindle-sync.author as "Author", kindle-sync.lastAnnotatedDate as "Last Highlighted", kindle-sync.highlightsCount as "Number of Highlights", ("") as "Book Cover"
From "Library"
SORT kindle-sync.lastAnnotatedDate desc
Limit 5
```
This snippet should show you how you can use DataView with Let'sns.
Let’s see how we can start incorporating it into our workflow.
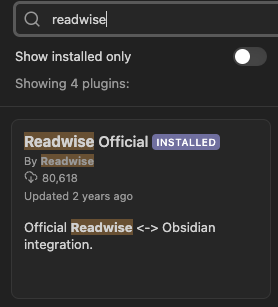
3. ReadWise tasks
Another plugin I use is the ReadWise plugin.
I use my ReadWise subscription to collect highlights from different sources and organise them in Obsidian. Acting on these highlights is essential to help you develop your ideas.
To remind me of these highlights, I have added a Task to each highlight in the ReadWise Obsidian Export template.
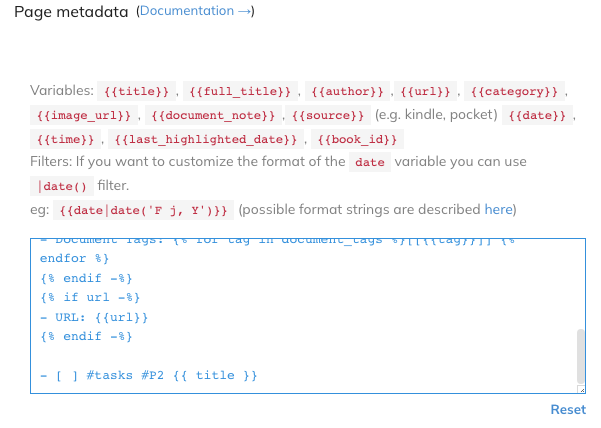
Adding this task to the metadata of a ReadWise highlight will automatically be added to my Obsidian vault.
By doing this, I can create a DataView that lists each of the notes that still need to be processed.
To do this, I must tell DataView to get a list of tasks. I use the where clause to filter out tasks that are complete.
I sort the notes by the most recent and limit it to 5.
```dataview
Task
From "Readwise"
WHERE status = " "
SORT file.cday desc
Limit 5
```
Let’s see it in action.
Again, this DataView lives on my dashboard.
If I hLet'spare time to process the highlight, I can select the task, which will link to the note to work on.
I then usually create an atomic note with my ideas and can tick off the task once I complete it.
I can add tags to this section if I want to filter further.
For example, if I wanted to see Tweets I highlighted, I can add #tweets to the From clause.
```dataview
Task
FROM "Readwise" and #tweets
WHERE status = " "
SORT file.cday desc
Limit 5
```
You have seen how combining different data types can help you find the notes you need.
Tags are essential, so in the next section, we look at using tags and DataView to generate content ideas.
If you enjoy the content and found it helpful, please press the like button so I know how to create similar content.
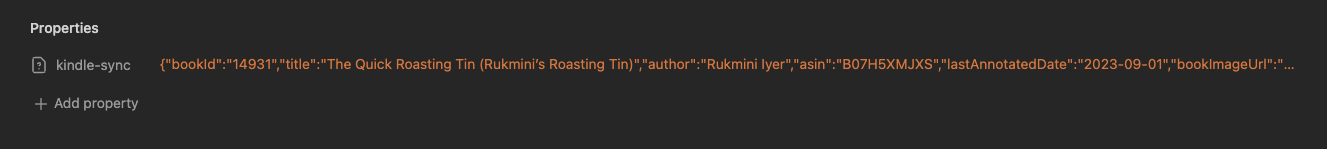
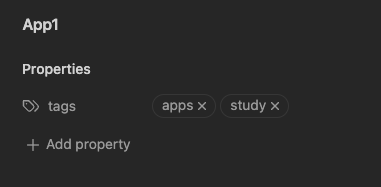
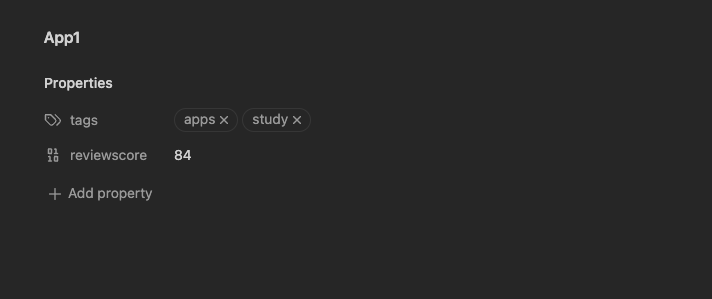
4. Properties
One of the latest features in Obsidian is the properties view.
The properties view allows you to add metadata to a note quickly.
I use this to add tags to notes.
Once tags have been added to notes, we can use DataView to search for them.
I have a folder with a list of apps I reviewed and notes against them.
When I want ideas for new content, I can use these tags.
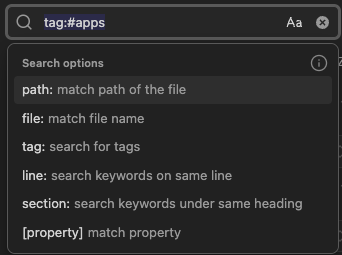
In the snippet below, I am using DataView. I am looking for creative apps.
I have a limit of 5.
```Dataview
Table tags
FROM "AppList" and #apps and #creative
Sort file.mtime DESC
Limit 5
```
Let’s see it in action.
Dataview tells me I must research more apps or think of another idea.
What about a list of study apps?
I can change the tag to look for the study tag.
```Dataview
Table tags
From "AppList" and #apps and #study
Sort file.mtime DESC
Limit 5
```
Great, I now have five apps for my review.
But how do I know these are any good?
I can add a new property in my notes to add a review score
I do this by pressing add property and giving it a label called ‘‘reviewscore’’
I can set the property type as a number and give it a score.
I can do this for all my app notes.
To use this in the DataView, I can add a where statement, which returns notes with a score.
To do this, I type where reviewscore > 80.
I can also add reviewscore to the Table to include it in the results.
```dataview
Table tags, reviewscore
From "AppList" and #apps and #study
Where reviewscore>80
Sort file.mtime DESC
Limit 5
```
Using tags, properties, and data view is a great way to find notes for content location.
But what about showing DataView in a chart?
The following snippet aims to combine DataView with the Obsidian Chart plugin, and it took three nights to work out a simple solution that I can share with you.
5. Obsidian Chart
I wanted to create a DataView that looked at tags I was researching to ensure my research looked at different topics.
To do this, we can use two more features of DataView: Flatten and Group by.
Flatten helps us break up the tags into individual tags.
length(rows.file.name) gives us a count of notes with those tags
Group by aggregating those counts to individual tags.
```Dataview
TABLE length(rows.file.name) as Count
FROM "AppList"
FLATTEN file.tags as Topic
GROUP BY Topic
SORT length(rows.file.name) desc
LIMIT 10
```
I combined this table with the Obsidian Chart plugin to show a bar graph of this data.
Things got tricky as I had to use DataView Javascript to combine the DataView I created with the Obsidian Chart code.
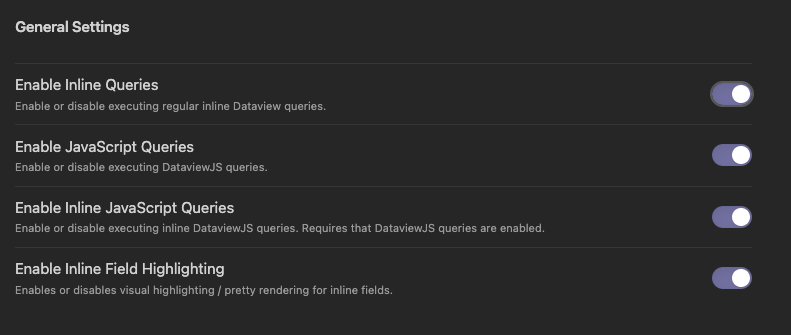
To run the Dataview javascript, you need to activate it on the DataView settings.
Users need to activate enabling JavaScript queries and enabling inline JavaScript query options.
My JavaScript abilities are limited.
So, I passed the code I used for my DataView in dv.query and mapped the columns.
```dataviewjs
const rawData = await dv.query('TABLE length(rows.file.name) as Count FROM "AppList" FLATTEN file.tags as Topic GROUP BY Topic SORT length(rows.file.name) desc LIMIT 10');

const rows = rawData.value.values;const chartData = {
 type: 'bar',

 data: {
  labels: rows.map(x => x[0]),

  datasets: [
   {label: 'Topics',
    data: rows.map(x => x[1]),
    backgroundColor: [ 'rgba(255, 99, 132, 0.2)' ],
    borderColor: [ 'rgba(255, 99, 132, 1)' ],
    borderWidth: 1
    }
  ],
 },

}
window.renderChart(chartData, this.container);
```
If you have the Obsidian Charts plugin installed, it will generate the bar chart.
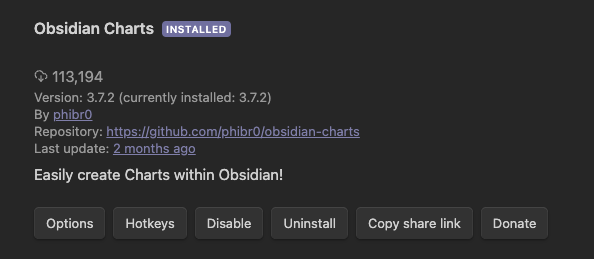
Users can customise charts thanks to the Obsidian Charts plugin, and documentation on the website provides you with many options to play around.
with. https://charts.phibr0.de/Meta/Charts/Obsidian+Charts+Documentation
Summary
I hope this article has helped with using DataView in your Obsidian workflow.
Thanks for reading, and thanks for subscribing. I appreciate the support.
If you enjoyed this article, check, then look at one of my other articles to help with your workflow.